
-
Many investors inform their sentiment about markets by looking for cycles in returns.
-
Rolling returns give a false sense of cyclicality because of overlap among consecutive periods.
-
Investors should avoid basing market expectations on this illusion of predictability.
Investors can be both motivated and well-equipped to see patterns in stock returns. Motivated, because successfully predicting market movements can be lucrative, and well-equipped, because evolution has programmed humans to err on the side of seeing patterns even when they’re not present.1
Many investors believe markets to be cyclical and search for signs of cycle status in an attempt to predict which investment styles are coming into and out of favor. Rolling stock returns are like a Venus flytrap for these investors. Multiyear returns expressed over overlapping periods often appear cyclical, implying prior returns are useful indicators of future returns. However, this is one cycle investors may want to avoid riding; rolling performance simply obscures the volatility in stock returns that is impeding predictability.
Many economic indicators can be described as cyclical. Measures such as GDP growth, inflation, and employment are relatively slow-moving and therefore highly autocorrelated—their values in any one period are strongly related to their values in the preceding period. Changes in stock market prices, on the other hand, are fast-moving. As such, autocorrelation of stock returns is negligible. One period’s return tells you almost nothing about the next.
Rolling returns look cyclical because of the overlap among rolling periods. For example, five-year rolling returns computed at the end of consecutive months have 59 out of 60 months in common. Rolling windows effectively create a smooth and slow-moving series with massive autocorrelation among observations, masking the underlying sequence of returns.
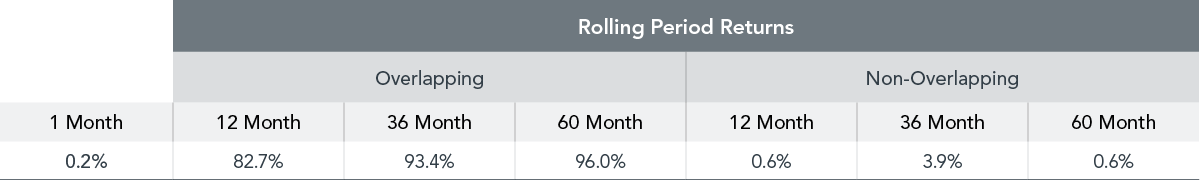
We can see this autocorrelation through the proportion of Russell 3000 Index returns explained by past return observations. A regression of the index’s monthly returns on the return in the preceding month2 produces an R-squared3 of just 0.2%. In other words, consecutive monthly returns have almost no correlation. However, rolling returns measured each month are highly correlated with the rolling return observed the following month—the percent of variation explained ranged from 82.7% using 12-month returns to 96% for five-year returns (see Exhibit 1). These values stand in stark contrast to the regressions of non-overlapping, rolling returns, for which consecutive observations are totally independent.
EXHIBIT 1
Overlaps in Judgment
Proportion of Russell 3000 Index return explained by its return in the preceding period
Past performance is not a guarantee of future results.
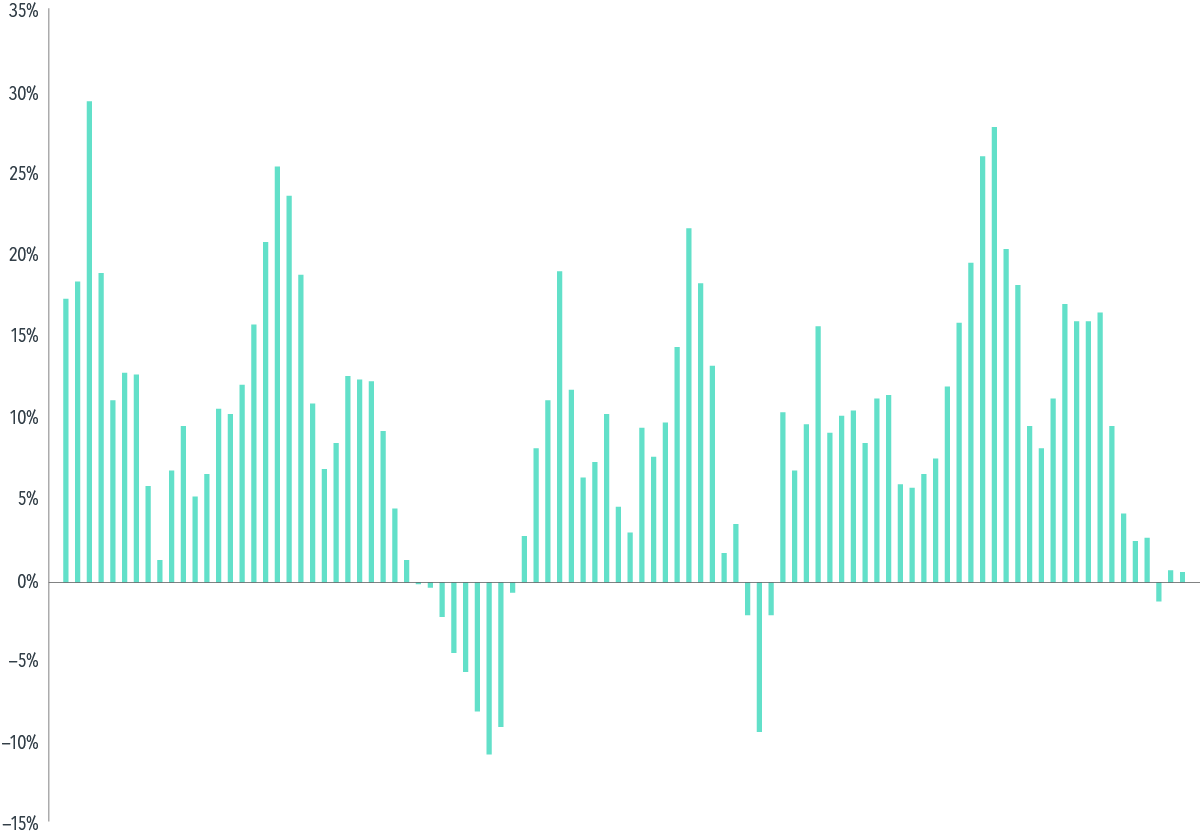
The strong autocorrelation of rolling, overlapping returns produces a cyclical appearance in returns. We can even demonstrate this using a series of returns drawn at random from a normal distribution, essentially precluding autocorrelation. The annual returns of this series, illustrated in the top panel of Exhibit 2, convey the randomness through an absence of any perceptible pattern. However, rolling returns in the bottom panel of Exhibit 2 exhibit periodic waxing and waning that would seem to imply predictability. Of course, the “predictability” is just an artifact of the overlap among consecutive observations. One year’s rolling return clearly has information about the next year’s rolling return, but this is about as insightful as me successfully guessing your name after you tell me what your name is.
EXHIBIT 2
Test Pattern
Annual and rolling, overlapping 5-year returns for a sequence of 1,200 randomly drawn monthly returns
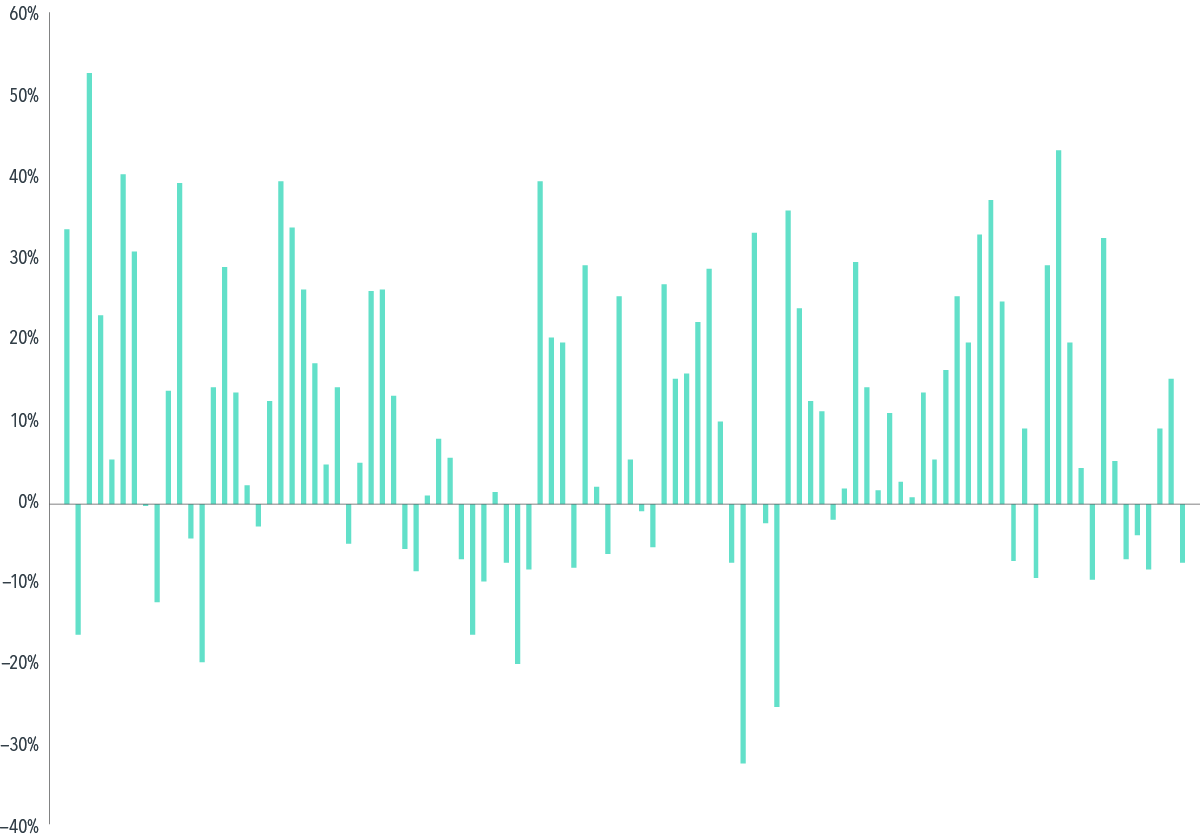
Rolling returns computed using a sequence of 1,200 returns drawn at random from a normal distribution with mean 1% and standard deviation 5%
Coming Full Circle
A cyclic stock market would present frequent opportunities for market timing. However, the paucity of outperforming active equity managers suggests predicting stock market movements is not that easy. Cyclicality may also imply expected stock returns periodically go negative, a difficult concept to square with a market that reflects risk and return. Stock markets have positive expected returns every day, and research tells us the most reliable way to capture those returns is to stay invested for the long haul.
FOOTNOTES
-
1Michael Shermer, “Patternicity: Finding Meaningful Patterns in Meaningless Noise,” Scientific American, December 1, 2008.
-
2This is sometimes referred to as an autoregressive (AR) model.
-
3An R-squared represents the proportion of the variance that’s explained by the regression.
GLOSSARY
Rolling stock returns: Multiperiod returns expressed at intervals of time.
GDP growth: The growth rate of the total value of goods and services produced by, for example, a country over a set period of time.
Autoregressive model: A process in which an output variable depends linearly on its own previous values.
DISCLOSURES
The information in this material is intended for the recipient’s background information and use only. It is provided in good faith and without any warranty or representation as to accuracy or completeness. Information and opinions presented in this material have been obtained or derived from sources believed by Dimensional to be reliable and Dimensional has reasonable grounds to believe that all factual information herein is true as at the date of this material. It does not constitute investment advice, recommendation, or an offer of any services or products for sale and is not intended to provide a sufficient basis on which to make an investment decision. Before acting on any information in this document, you should consider whether it is suitable for your particular circumstances and, if appropriate, seek professional advice. It is the responsibility of any persons wishing to make a purchase to inform themselves of and observe all applicable laws and regulations. Unauthorized reproduction or transmitting of this material is strictly prohibited. Dimensional accepts no responsibility for loss arising from the use of the information contained herein.
“Dimensional” refers to the Dimensional separate but affiliated entities generally, rather than to one particular entity. These entities are Dimensional Fund Advisors LP, Dimensional Fund Advisors Ltd., Dimensional Ireland Limited, DFA Australia Limited, Dimensional Fund Advisors Canada ULC, Dimensional Fund Advisors Pte. Ltd, Dimensional Japan Ltd. and Dimensional Hong Kong Limited. Dimensional Hong Kong Limited is licensed by the Securities and Futures Commission to conduct Type 1 (dealing in securities) regulated activities only and does not provide asset management services.
RISKS
Investments involve risks. The investment return and principal value of an investment may fluctuate so that an investor’s shares, when redeemed, may be worth more or less than their original value. Past performance is not a guarantee of future results. There is no guarantee strategies will be successful.
UNITED STATES
Dimensional Fund Advisors LP is an investment advisor registered with the Securities and Exchange Commission.
Investment products: • Not FDIC Insured • Not Bank Guaranteed • May Lose Value
Dimensional Fund Advisors does not have any bank affiliates.
CANADA
These materials have been prepared by Dimensional Fund Advisors Canada ULC. The other Dimensional entities referenced herein are not registered resident investment fund managers or portfolio managers in Canada.
Commissions, trailing commissions, management fees, and expenses all may be associated with mutual fund investments. Please read the prospectus before investing. Unless otherwise noted, any indicated total rates of return reflect the historical annual compounded total returns including changes in share or unit value and reinvestment of all dividends or other distributions and do not take into account sales, redemption, distribution, or optional charges or income taxes payable by any security holder that would have reduced returns. Mutual funds are not guaranteed, their values change frequently, and past performance may not be repeated.
This material is not intended for Quebec residents.
JAPAN
For Institutional Investors and Registered Financial Instruments Intermediary Service Providers.
This material is deemed to be issued by Dimensional Japan Ltd., which is regulated by the Financial Services Agency of Japan and is registered as a Financial Instruments Firm conducting Investment Management Business and Investment Advisory and Agency Business.
Dimensional Japan Ltd.
Director of Kanto Local Finance Bureau (FIBO) No. 2683
Membership: Japan Investment Advisers Association
SINGAPORE
This material is deemed to be issued by Dimensional Fund Advisors Pte. Ltd., which is regulated by the Monetary Authority of Singapore and holds a capital markets services license for fund management.
This advertisement has not been reviewed by the Monetary Authority of Singapore, and should not be shown to prospective retail investors.
FOR PROFESSIONAL INVESTORS IN HONG KONG
This material is deemed to be issued by Dimensional Hong Kong Limited (CE No. BJE760) (“Dimensional Hong Kong”), which is licensed by the Securities and Futures Commission to conduct Type 1 (dealing in securities) regulated activities only and does not provide asset management services.
This material should only be provided to “professional investors” (as defined in the Securities and Futures Ordinance [Chapter 571 of the Laws of Hong Kong] and its subsidiary legislation) and is not for use with the public. This material is not intended to constitute and does not constitute marketing of the services of Dimensional Hong Kong or its affiliates to the public of Hong Kong. When provided to prospective investors, this material forms part of, and must be provided together with, applicable fund offering materials. This material must not be provided to prospective investors on a standalone basis. Before acting on any information in this material, you should consider whether it is suitable for your particular circumstances and, if appropriate, seek professional advice.
Neither Dimensional Hong Kong nor its affiliates shall be responsible or held responsible for any content prepared by financial advisors. Financial advisors in Hong Kong shall not actively market the services of Dimensional Hong Kong or its affiliates to the Hong Kong public.
By Wes Crill, PhD Head of Investment Strategists and Vice President
 Learn more about Monica.
 I am a creative CERTIFIED FINANCIAL PLANNER® professional providing financial planning & tax strategies for clients by accurately assessing each client’s present and future needs, objectives, and lifelong goals. My empathetic and engaging personality helps guide clients through retirement as they discuss all of life’s complexities; focusing on specific tax strategies and evidence-based investment philosophy to meet every client’s unique goals and circumstances.
 During my salad days, I studied business at the University of Minnesota and the Carlson School of Management. Taking this route seemed to make sense when I graduated high school, as it offered the opportunity to pursue a career in business. However, the experience didn’t go as planned. I found myself disillusioned by the focus and teachings of business school, with many of the lessons revolving around detached relationships focused solely on profit. I eventually concluded that this was not my personal path. I chose instead to purse a passion – writing – and veered off into journalism for the next six years of my life.
Pingback: cheapest buy androxal uk how to get
Pingback: how to order enclomiphene generic form
Pingback: buy rifaximin generic next day delivery
Pingback: purchase xifaxan purchase to canada
Pingback: online order staxyn generic mexico
Pingback: purchase avodart uk delivery&
Pingback: order dutasteride cheap melbourne
Pingback: Order flexeril cyclobenzaprine online no membership overnight shipping
Pingback: get gabapentin no prescription mastercard
Pingback: buying fildena generic new zealand
Pingback: how buy itraconazole canada
Pingback: kamagra online bez lékařského předpisu přes noc
Pingback: où puis-je obtenir générique kamagra en ligne pas cher